What is
creative testing
on Flickly?
Creative testing on Flickly helps brands test advertising creatives with real consumers before launch.
Measure ad effectiveness, audience engagement, brand recall and purchase intent using insights from Flickly’s 65M+ verified global panel.
Identify what resonates with consumers and optimise video ads before investing in media spend.
What video views fail to tell you about your audience
Views are not attention
A view counts the moment a video starts, even if the person scrolls away two seconds later.
Platform tests charge you first
Meta and Google A/B tests run inside live campaigns, so you pay to show every version, including the weak ones. By the time a winner emerges, that budget is already spent.
Teams pick by gut feel
Founder-led, UGC or influencer? Without real data, the choice is a guess.
Test any video: Ads, UGC, demos or brand films
Test two or three cuts of the same ad and find the one people watch longest and would buy from, before the media budget goes behind it.
Compare creators and formats with the same audience. See whose video holds attention and whose message people remember.
Check that people understand what your product does by the end of the demo, and where they stop following.
Test the story before launch day. See how many people stay to the end and what they take away.
How to test a video on Flickly
- 01
Upload your video
Add your video ad, UGC clip or brand film to a question. Flickly shows it to each respondent before they answer.
- 02
Set how much people must watch
Choose no requirement, a number of seconds, a percentage or the full video. Skipping ahead and speed changes are always blocked.
- 03
Questionnaire building
Build the questions people answer after the video. Start from a template or write your own, choose question types such as multiple choice, rating scales and open text, and add logic so each respondent only sees the questions that apply to them. Preview the full survey before you launch.
- 04
Choose your audience and publish
Pick countries, cities and the number of responses, and your test goes out to real people on Flickly’s 65M+ verified panel.
- 05
Read the results by audience
See how many watched, how far they got and what they’d buy, split by age, gender, income and city.
What you learn from every video test
Every video gets its own card in the Videos tab, with five numbers you can split by age, gender, income and city.
Video analytics, second by second
See exactly when viewers drop off, how far they get and whether the people who watched answered differently, for every video in your study.
Audience retention
Share of viewers still watching at each second. Shaded area is the steepest drop-off.
What stands out
- Biggest drop-off: 0:06–0:09, where 11% of viewers left before the first bite.
- 54% watched to the end; on average viewers saw 72% of the video.
- 91% of viewers met the 0:10 watch requirement.
- Viewers who met the requirement named the right brand 47 points more often.
Pick the winner before you spend
Show every version to the same audience. The one people watch longest and would buy from is the one that gets your budget.


Ask Flickly AI why one video won
Ask about your results in plain words, and get the answer with the data behind it.
See Ask AI in the dashboardReal attention, from real people
Every number on your dashboard comes from verified people who actually watched your video, with careless answers already removed.
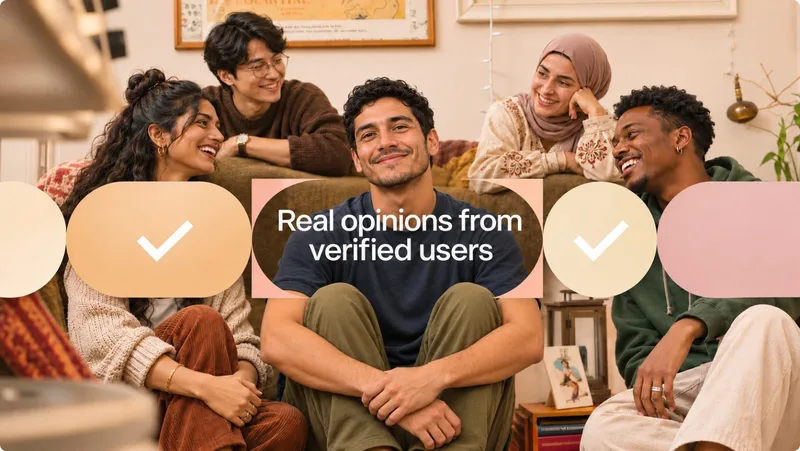
65M+ verified users
Your video is watched by people from a 65M+ verified panel, not bots or synthetic respondents.
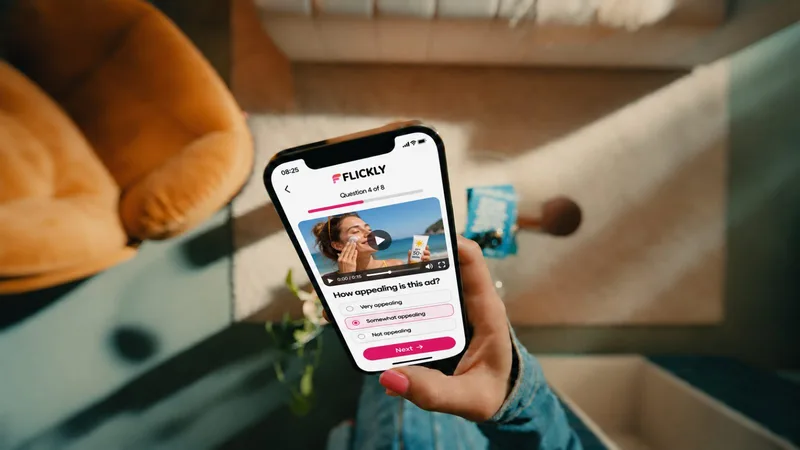
Real attention
Must-watch rules, with skipping ahead and speed changes blocked, so every answer comes after the video.
Verified answers, guaranteed
Flickly’s Decision Intelligence layer identifies rushed, careless and low-quality responses, scoring and filtering them out before they reach your results.
How creative testing compares with other ways to test a video
Flickly tests your video with verified respondents before launch and delivers decision-ready results in 72 hours.
| Comparison | Creative testing on Flickly | Platform A/B testing | Agency ad pre-testing | Video surveys |
|---|---|---|---|---|
| What it answers | Which video will perform best, and why, before launch | Which live ad is performing better | How an ad is likely to perform compared with past ads | What people say about a topic in their own words |
| When it happens | Before launch | After launch, while media is running | Before launch | At any time |
| Who you learn from | Verified people you select by country and city, with results by age, gender, income and city | People the ad platform selects to show the ad to | A sample recruited by the agency | People who agree to record themselves on camera |
| How you know they watched | Watch requirements, with skipping ahead and speed changes blocked | Watch time and completion rates, with no requirement to watch | Viewing in a controlled test setting | Not applicable, as respondents record answers and do not watch a video |
| Data quality | Decision Intelligence scores every response and removes rushed or low-quality answers | Results can include accidental clicks and invalid traffic | Depends on the agency’s own quality checks | Depends on recording quality and manual review |
| Comparing versions | Several versions tested with the same audience in one study | Each version requires its own media budget | Each additional version usually increases the cost | Not designed for comparing video versions |
| What comes back | Viewers, average watched, watched to the end and watch time, plus recall, liking and purchase intent from questions after the video | Views, watch time, completion rates, clicks and conversions | A scored report, often compared against norms | Transcripts and sentiment |
| Audience splits | Every metric by age, gender, income and city | Breakdowns available in the ad platform’s reports | Available, depending on sample size and budget | Possible, but samples are usually smaller |
| Finding out why | Answers to questions after the video, plus Ask AI | Not directly measured | Explained in the agency report | From what respondents say on camera |
| What it costs you | One research study, paid in Flickly credits | Media spend on every version, including versions that do not perform | Agency fees for each study | One research study |
| How fast | Decision-ready results in 72 hours | Days or weeks of media spend before a clear result | Days to several weeks, depending on the agency | Days, plus time to review the recordings |
| Best for | Choosing the right ad, UGC video, product demo or brand film before launch | Improving a campaign that is already running | Large TV and brand campaigns | Hearing reactions in respondents’ own words |
Platform A/B testing means split tests run inside ad platforms such as Meta or YouTube. Agency ad pre-testing means ad tests run by a research agency before launch. Video surveys are surveys where respondents record their answers on camera.
Common mistakes when testing videos
Testing only one version
Without a second option, there is nothing to compare against.
Skipping the watch rule
If people can move on early, you measure clicks, not attention.
Testing on the wrong audience
Results only count if the viewers look like your buyers.
Ignoring where people drop off
The moment attention falls tells you what to fix.
Frequently asked questions
Meta and Google test creatives through live ad campaigns, where performance depends on media spend, platform delivery and audience exposure. Flickly lets you test multiple video creatives before launch, with real consumers from its 65M+ panel, without spending on media. Instead of relying only on clicks and conversions, Flickly captures how consumers respond to each creative, including video watch time, completion, brand recall and purchase intent. This helps you compare creative effectiveness, understand what resonates with your target audience and identify the strongest version before investing in an ad campaign.
Creative testing is a research method that measures how real people respond to a video, ad or visual before launch. On Flickly, respondents from a panel of 65M+ verified users watch a video, and the platform measures watch time, completion rate, brand recall and purchase intent.
To test a video before launch on Flickly, upload the video to a survey question, choose a watch requirement, select the target audience and publish the survey. Respondents watch the video and answer questions about it. Results are available in 72 hours, by age, gender, income and city.
Creative testing compares video versions before launch with a selected audience. A/B testing compares ad versions after launch, with paid media spend on every version. Creative testing identifies the strongest version before any media budget is spent. A/B testing measures clicks and conversions from versions that are already running.
Flickly measures five video metrics: number of viewers, average percentage watched, percentage who watched to the end, percentage who met the watch requirement, and average watch time. Survey questions after the video measure brand recall, liking, message clarity and purchase intent.
Video testing typically uses 150 to 300 respondents per video version. A larger sample is required to compare results between audience groups, such as age groups or cities. On Flickly, the number of responses is selected in the Audience step of the survey.
Yes. Flickly creative testing supports UGC videos, influencer videos, founder-led ads, product demos and brand films. Testing several creator videos with the same audience shows which video has the highest completion rate, brand recall and purchase intent.
To compare multiple versions of a video, show each version to the same target audience in one study and compare the results side by side. Flickly shows each video in its own card in the Videos tab, and Ask Flickly AI explains the differences between versions in plain language.
Flickly uses watch requirements. A survey can require respondents to watch a minimum number of seconds, a minimum percentage or the full video before they answer. Skipping ahead and changing playback speed are always blocked. Decision Intelligence removes responses that are rushed or low in quality.
Yes. Flickly runs video testing in India with city-level targeting. Flickly also covers the United States, the United Kingdom, Japan, Germany, France, Australia, Canada, Brazil and Singapore.
Video testing on Flickly is priced in credits. The cost depends on the number of responses and the countries selected. There is no media spend, because the test runs before launch. Book a demo with Flickly for a quote.